 CoreAxis ePOS
Reports
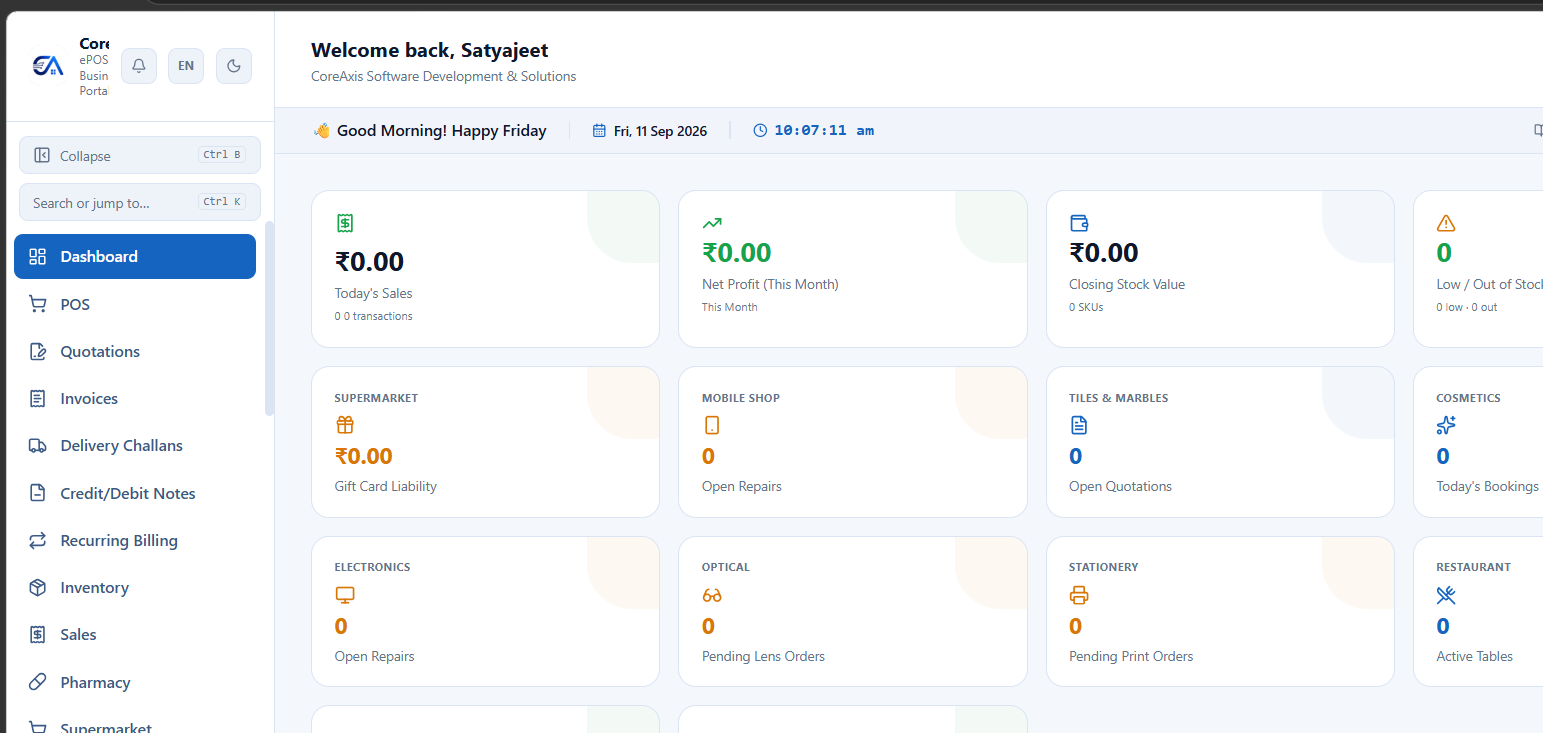
Dashboard — real-time overview of sales, profit, stock, and industry-specific KPIs
Dashboard
The main dashboard shows key business metrics at a glance:
- Today's sales, total revenue, outstanding receivables, top-selling products.
- Sales trend chart, payment-mode breakdown, recent invoices.
- Enhanced Dashboard: Extended KPIs including profit margin, customer acquisition, inventory value, and cash position.
- Dashboard layout is customizable — drag-and-drop widgets to arrange your preferred view.
Sales Report
Detailed sales data with filters for date range, customer, product, category, payment method, and branch.
- View individual sale details by clicking any row.
- Export to Excel/CSV with one click.
Stock Report
Current stock position across all products, branches, and godowns.
- Filter by category, brand, or stock level.
- View stock value (at cost price and selling price).
Daily Summary
A comprehensive end-of-day report that gives you the complete picture of business activity.
- Sales Summary: Total sales amount, number of invoices, average invoice value.
- Payment Breakdown: Cash vs UPI vs Card vs Credit — see exactly how money came in.
- Top Products: Best-selling items for the day by quantity and revenue.
- Returns & Cancellations: Total returns processed and their value.
- Expenses: All expenses recorded for the day.
- Net Cash Position: Opening cash + Cash sales - Cash expenses = Closing cash. Compare with your physical cash drawer.
Tip: The Daily Summary auto-generates at end of each shift. You can also schedule it as an email to the owner at close of business.
P&L Report
ABC Analysis
Classify products by contribution to total sales revenue:
- A items: Top 20% of products contributing ~80% of revenue — your star performers.
- B items: Next 30% contributing ~15% of revenue.
- C items: Bottom 50% contributing ~5% of revenue — candidates for delisting or promotion.
Slow-Moving Stock
Identify products that haven't sold or have very low sales velocity over a chosen period.
- Set the threshold — e.g., "products with fewer than 5 units sold in the last 90 days".
- View current stock value tied up in slow-moving items.
- Sort by days since last sale to find dead stock.
- Use for clearance sale planning, discount campaigns, or delisting decisions.
- Combine with ABC Analysis — C items with slow velocity are the strongest delisting candidates.
Branch Consolidated Report
Branch Reports Module
Aggregate data across all branches into a single unified report.
- Revenue by Branch: Compare sales performance across branches — bar chart and table.
- Stock by Branch: See stock levels for any product across all branches — identify which branch has surplus and which needs restocking.
- Expense by Branch: Branch-wise expense comparison.
- Staff by Branch: Attendance and productivity metrics per branch.
- P&L by Branch: Individual profit/loss statement for each branch.
- Filters: Date range, specific branches, specific product categories.
Export & Scheduled Reports
- One-click export: Every report has an Export button — download as Excel or CSV.
- PDF export: Financial statements (P&L, Balance Sheet, Cash Flow) can be exported as PDF.
- Scheduled Reports: Set up automatic report emails — choose the report, frequency (daily/weekly/monthly), and recipients. Reports are generated and emailed automatically.